Use these Z Tables (Z Charts) to find the area (probability) of a z-score. Learn how to use a Z Table, and how to calculate Z Scores.
Z Table and Z-Scores.
The Z Table, also called the z-score table, standard normal distribution table, or z-value chart, helps you find probabilities for a given z-score. A z-score shows how far a data point is from the mean, measured in standard deviations.
Z-Table – Left of The Mean (Negative Z-Scores).
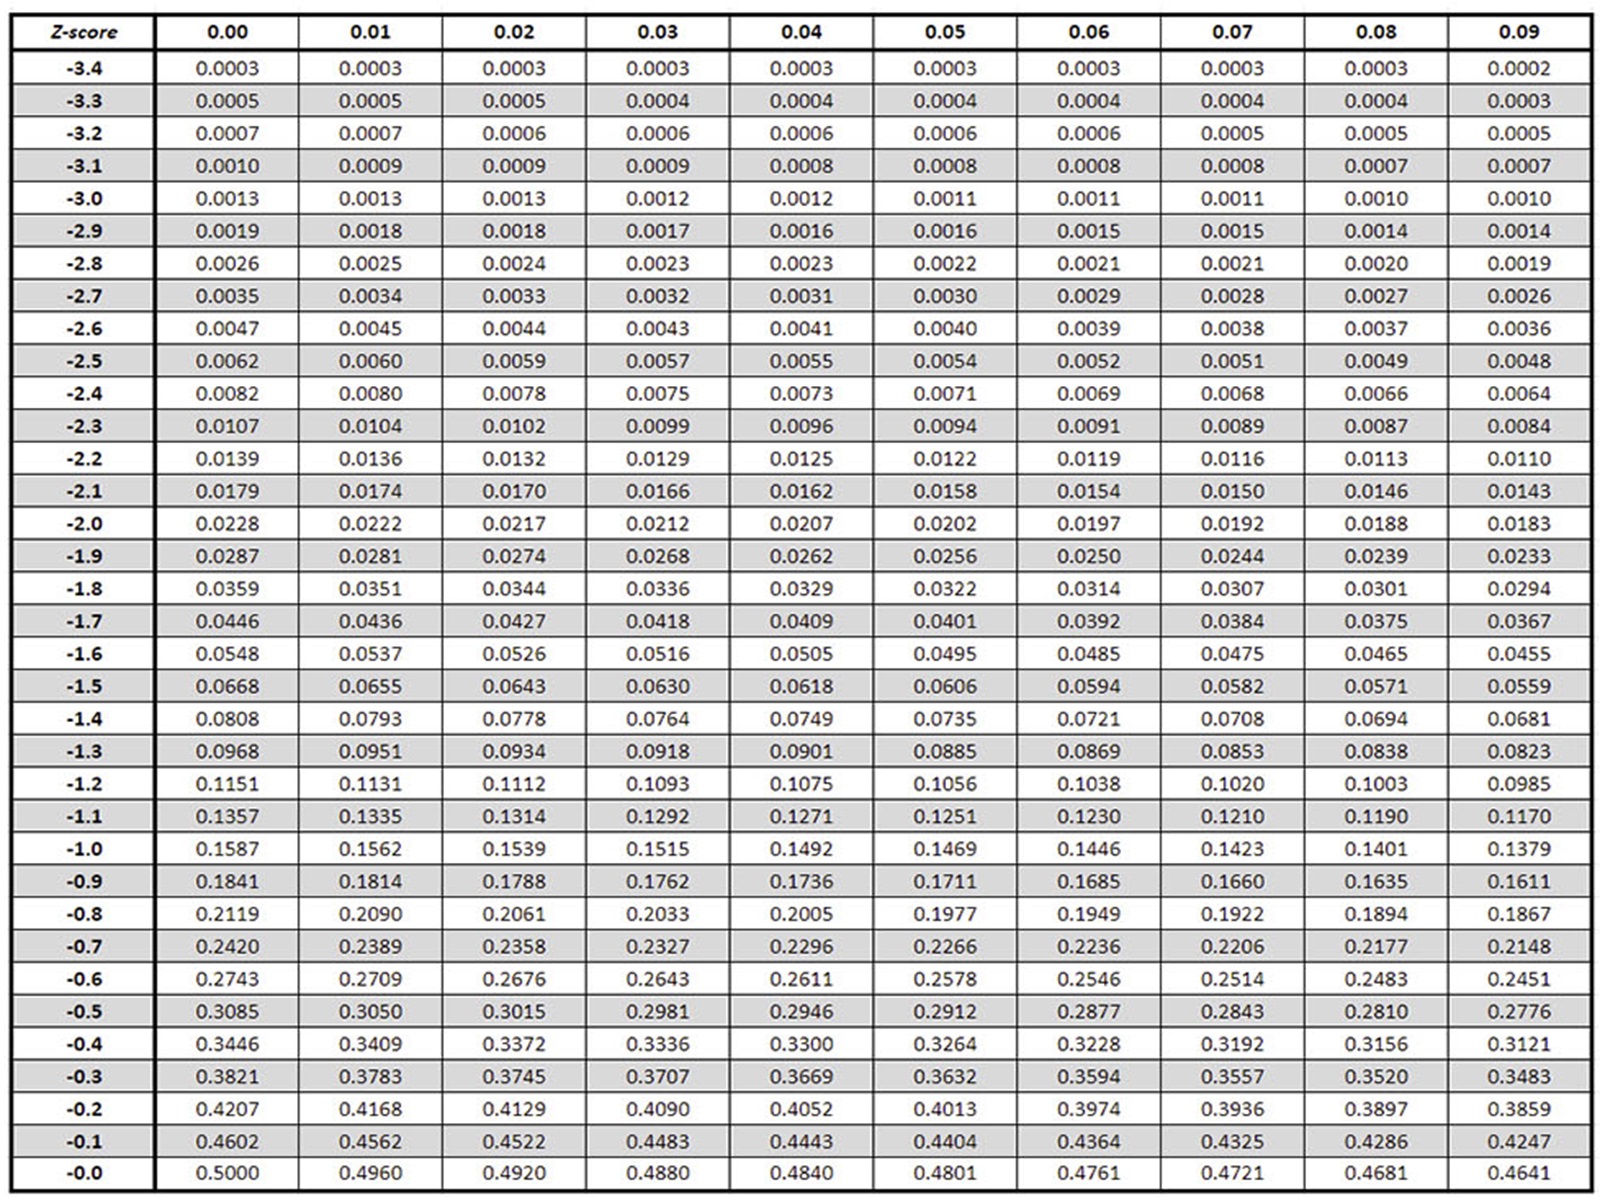
The Z Table below shows the Z-scores to the LEFT of the mean, or below the mean.
Understanding the Left Z-Score Table (Negative).
The left Z-score table below displays Z-scores in the first column, which represent values below the mean. The table’s main body provides the probability of a value being at or below a specific Z-score. The Z-score is shown with the 1st decimal in the first vertical column (-3.4,-3.3 etc), and the 2nd decimal on the first horizontal line (0.00, 0.01 etc). For example, a Z-score of -1.96 corresponds to a probability of about 0.025, meaning there is a 2.5% chance that a score will fall below this Z-score in a standard normal distribution.

Z Table – Right of The Mean (Positive Z-Scores).
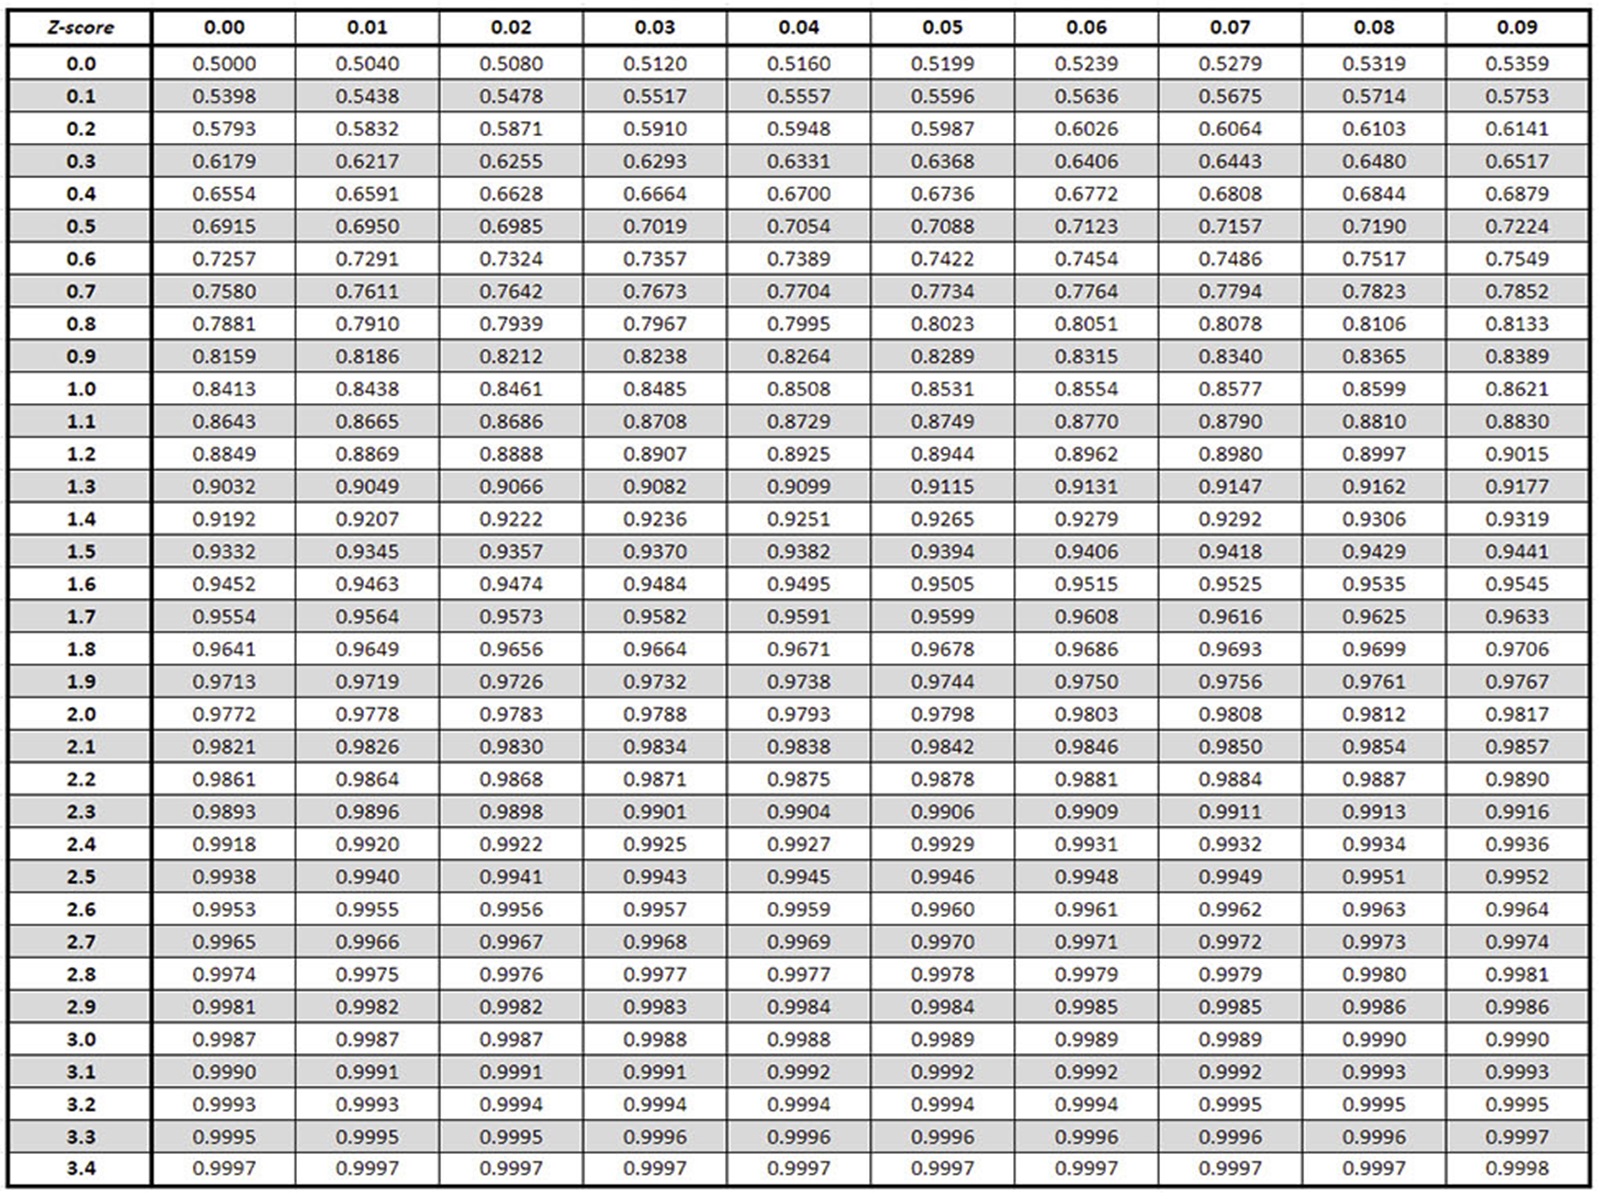
The right Z-score table below focuses on positive Z-scores, which represent values above the mean. It shows the probability of a score being at or above a specific Z-score. The Z-score is shown with the 1st decimal in the first vertical column (0.0, 0.1 etc), and the 2nd decimal on the first horizontal line (0.00, 0.01 etc). For instance, a Z-score of 1.96 in the right-tailed table show the number 0.9750, and indicates a 2.5% chance of a score being greater than this value in a standard normal distribution.

If you’re unsure how to use a Z Table, don’t worry! You can use our Z-Score Calculator to easily calculate probabilities or z-scores.
How to Use the Z Table.
- Negative Z-Scores (Left of the Mean): Use the Negative Z Table for values below the mean. The table shows the probability of a z-score being less than the given value (the area under the curve to the left of z).
- Positive Z-Scores (Right of the Mean): Use the Positive Z Table for values above the mean. Similarly, it shows the area to the left of z, meaning it represents the percentage of scores below the given value.
Z-Tables Explained.
Z-tables provide the probabilities of an observed statistic falling above, below, or between specific values in a standard normal distribution (also known as the Z-distribution). They are valuable tools because any normal distribution can be converted into a standard normal distribution.
Thanks to the central limit theorem, which states that many test statistics follow a normal distribution if the sample size is large enough, Z-tables have widespread applications. They allow us to easily determine probabilities for various test statistics without needing to manually calculate the integral of the normal distribution’s probability density function.
There are two main types of Z-score tables, and understanding the difference is essential:
1. Cumulative Z-Score Tables
These are the most commonly used Z-score tables. They provide the cumulative probability from the far left of the standard normal distribution (starting at negative infinity) to the given Z-score. In other words, they show the probability of a value being less than or equal to the given Z-score.
- Example: A Z-score of 1.00 in a cumulative table corresponds to a probability of 0.8413, meaning 84.13% of the data falls below this value.
2. Non-Cumulative (Tail) Z-Score Tables
These tables provide probabilities for the area in the tail of the distribution beyond the given Z-score. In other words, they show the probability of a value being greater than the Z-score (for the right tail) or less than the Z-score (for the left tail).
- Example: If a Z-score of 1.00 corresponds to a cumulative probability of 0.8413, the tail probability would be 1−0.8413=0.15871 – 0.8413 = 0.1587, meaning 15.87% of the data is greater than this value.
Which is More Common?
Cumulative Z-score tables are the most widely used because they simplify many statistical calculations, such as determining probabilities, finding p-values, and working with confidence intervals. Non-cumulative tables are less common but may be helpful in specific applications, such as hypothesis testing.
Do All Z Tables Show the Same Scores and Percentages?
Yes, all Z-tables have the same scores and percentages, but they may present the data in different ways. This is because Z-tables are based on the standard normal distribution, which is a universal mathematical model. Here’s what you need to know:
What’s the Same Across All Z-Tables?
- Z-Scores: The Z-scores themselves are consistent across all Z-tables. For example, a Z-score of 1.00 will always represent the same position (1 standard deviation above the mean) on the standard normal distribution curve.
- Probabilities (Percentages): The cumulative probabilities for each Z-score are also consistent. For instance:
- A Z-score of 1.00 corresponds to a cumulative probability of 0.8413 (84.13%).
- A Z-score of -1.00 corresponds to a cumulative probability of 0.1587 (15.87%).
Why Do Some Z-Tables Look Different?
Although the scores and percentages are the same, Z-tables can be formatted differently to make them easier to use for specific purposes:
- Cumulative Z-Tables:
- Most common format.
- Show the probability of a score being less than or equal to a given Z-score.
- Example: For Z = 1.00, the cumulative probability is 0.8413, meaning 84.13% of values fall below this Z-score.
- Right-Tail Z-Tables:
- Less common.
- Show the probability of a score being greater than a given Z-score (the area in the right tail of the curve).
- Example: For Z = 1.00, the right-tail probability is 1−0.8413=0.15871 – 0.8413 = 0.1587, meaning 15.87% of values fall above this Z-score.
- Two-Tailed Z-Tables:
- Rare, but some Z-tables provide probabilities for both left and right tails combined.
- Example: For Z = 1.96, the two-tailed probability might indicate the area beyond ±1.96, commonly used in hypothesis testing (5% total for a 95% confidence interval).
S, to sum up all the Z-scores and probabilities are always the same because they are based on the universal properties of the standard normal distribution. The difference lies in how the data is presented (e.g., cumulative vs. tail probabilities).
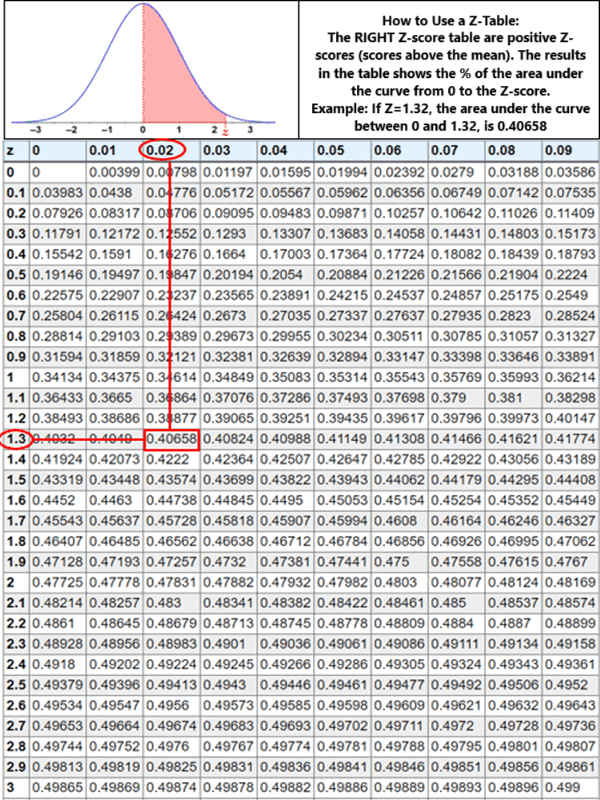
Below is an example of how to find a percentage on a (hypothetical) a cumulative Z-table. Ignore the numbers as they are not the standard normal distribution. First, locate the Z-score’s 1st decimal in the first vertical column on the left side (0, 0.1,0.1 etc), and then find the Z-score’s 2nd decimal on the first horizontal line (0.00, 0.01, 0.02 etc). Then find the percentage (probability), which in this example is 0.40658, or 40.658%.

Z Charts and Z Scores.
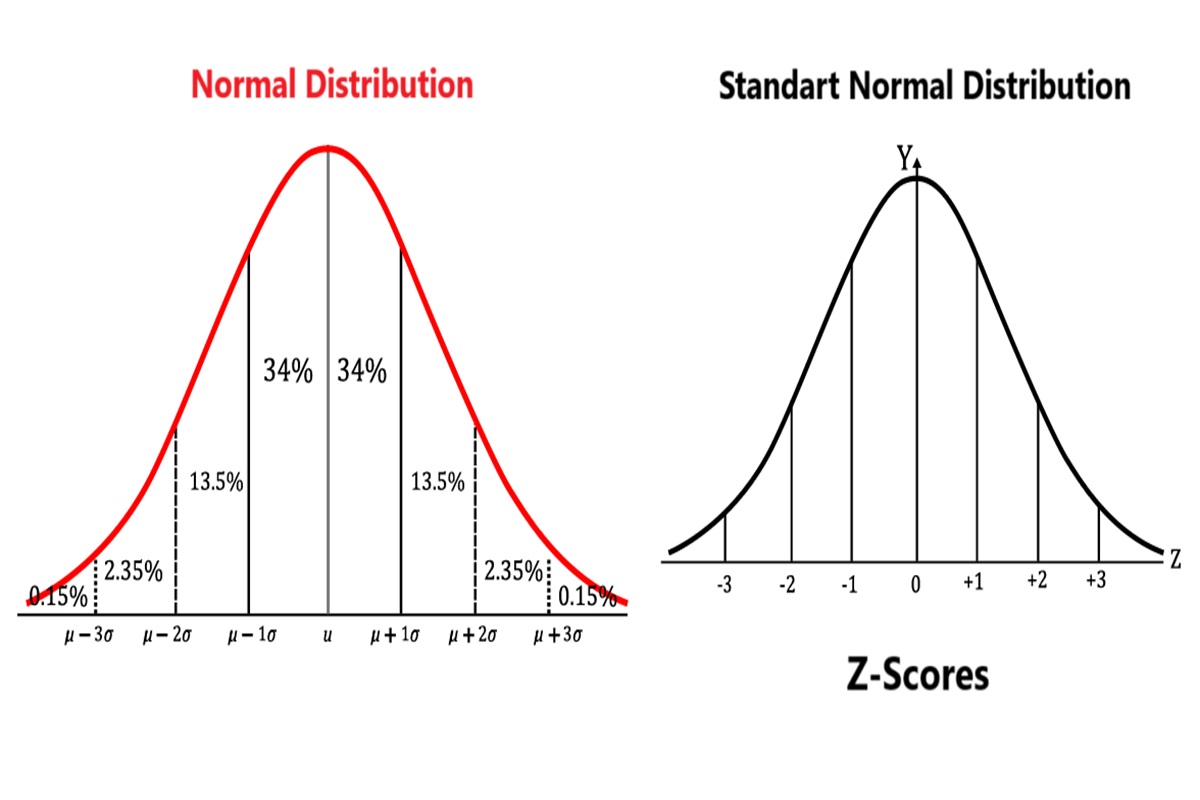
A Z-score is used to standardize a bell curve by centering the mean at zero (on the y-axis) and measuring how far a data point is from the mean in terms of standard deviations. Z-scores represent standard scores, indicating positions to the left or right of the mean.
- A Z-score of 1 means the value is 1 standard deviation above the mean.
- A Z-score of -1 means the value is 1 standard deviation below the mean.
Simply put, a Z-score tells you how many standard deviations a data point is from the mean and helps identify its position on a normal distribution curve.

Z-Score Probability Calculator.
Want to calculate probabilities quickly? Use a Z-Score Probability Calculator (coming soon!) Here’s how:
- Enter the z-score in the “Enter z-score” field.
- Enter the probability level in the “Enter probability level” field.
- Click “Calculate.”
- View the left tail probability (probability of being less than the z-score) and the right tail probability (probability of being greater than the z-score).
The left tail represents values below the z-score, while the right tail represents values above it.
Z-Score Example:
Let’s look at a real-world example:
- Scenario: Peter scored 700 on a test out of 1000. The average score (mean) is 600, and the standard deviation is 150. How well did George do compared to his peers?
Step 1: Calculate the Z-Score
Use the formula:
Z=(X−μ)σZ = \frac{(X – \mu)}{\sigma}
Where:
- XX = Peter’s score = 700
- μ\mu = Mean = 600
- σ\sigma = Standard deviation = 150
Z=(700−600)150=0.67Z = \frac{(700 – 600)}{150} = 0.67
Step 2: Find the Probability
Look up 0.67 in the Positive Z Table:
- Find 0.6 on the y-axis and 0.07 on the x-axis.
- The table value is 0.7486, meaning 74.86% of students scored lower than George.
Step 3: Interpret the Results
- 74.86% of the 200 students scored lower than Peter.
- That’s approximately 200×0.7486=150200 \times 0.7486 = 150 students.
- Peter outperformed 150 students!
FAQ – Z-Scores.
What is a z-score?
z-score tells you how many standard deviations a data point is from the mean.
What is a Normal Distribution Table?
A normal distribution table (commonly called a z-table) is a mathematical tool that provides the probabilities associated with a z-score in a standard normal distribution. A z-score measures how far a data point is from the mean, expressed in terms of standard deviations.
- Standard Normal Distribution:
- A z-table is based on the standard normal distribution, which has a mean (μ\mu) of 0 and a standard deviation (σ\sigma) of 1.
- The total area under the curve equals 1 (or 100%), representing all possible outcomes.
- What It Shows:
- The table provides the cumulative probability of a value being less than or equal to a given z-score.
- For example, a z-score of 1.00 corresponds to a cumulative probability of 0.8413, meaning there is an 84.13% chance of a value being below that z-score.
- Two Types of Z-Tables:
- Negative Z-Table: Used for z-scores less than 0 (values below the mean).
- Positive Z-Table: Used for z-scores greater than 0 (values above the mean).
How to Use a Z-Table?
- Locate the Z-Score: The z-score is typically given in the format Z=X.XXZ = X.XX, where the first digit and the first decimal place are on the table’s rows, and the second decimal place is on the columns.
- Find the Probability: Match the row and column to find the cumulative probability for the given z-score.
Why is the Z-Table Useful?
- Data Analysis: It helps determine the percentage of data points below or above a certain value in a dataset.
- Statistical Testing: It’s widely used in hypothesis testing and confidence interval calculations.
- Real-World Applications: Commonly applied in areas like education, healthcare, finance, and quality control to evaluate probabilities and make decisions.
What does a positive or negative z-score mean?
- Positive: The value is above the mean.
- Negative: The value is below the mean.
How to calculate a z-score?
How do I find a Z-score?
Use the formula to calculate a Z score:
Z=(X−μ)σZ = \frac{(X – \mu)}{\sigma}
Where XX is the data point, μ\mu is the mean, and σ\sigma is the standard deviation.
Z-Score Examples – Problems and Solutions.
- Height Example:
- Mean = 65 inches, SD = 3 inches.
- A student’s height = 70 inches.
- Z=(70−65)3=1.67Z = \frac{(70 – 65)}{3} = 1.67.
The student’s height is 1.67 standard deviations above the mean.
- Salary Example:
- Mean salary = $50,000, SD = $5,000.
- An employee earns $60,000.
- Z=(60,000−50,000)5,000=2Z = \frac{(60,000 – 50,000)}{5,000} = 2.
This employee earns 2 standard deviations above the average salary.
- Income Example:
- Survey mean income = $50,000, SD = $10,000.
- Participant income = $70,000.
- Z=(70,000−50,000)10,000=2Z = \frac{(70,000 – 50,000)}{10,000} = 2.
The z-score of 2 means the participant’s income is 2 standard deviations above the mean. Referring to the z-table for a z-score of 2.00, the probability is 0.9772. This means 97.72% of participants earned less than $70,000, and only 2.28% earned more. Out of 250 participants, 0.9772×250=2440.9772 \times 250 = 244. So, 244 participants earned less than this individual.
The Z Table is a powerful tool for analyzing data. Use it to find probabilities, compare values, or identify outliers in your dataset. If you need more help, try the Z-Score Calculator or check out our mobile app for easier access!
